
TL;DR:
- Conversion optimisation increases the percentage of website visitors who complete desired actions and is essential for digital marketing success. It involves data-driven techniques like A/B testing, heatmaps, and funnel analysis to identify and fix structural barriers that hinder conversions. Systematic, evidence-based testing and trust signals significantly improve website performance and business growth.
Conversion optimisation is the systematic process of increasing the percentage of website visitors who complete a desired action, such as making a purchase, submitting an enquiry, or signing up for a newsletter. Known formally as Conversion Rate Optimisation, or CRO, it sits at the heart of any serious digital marketing strategy. The UK e-commerce average conversion rate stood at 1.51% as of january 2026. That figure means roughly 98 out of every 100 visitors leave without converting, which makes CRO one of the highest-return activities a business can invest in.
What is conversion optimisation and how is it calculated?
The conversion rate formula is straightforward: divide the number of conversions by the total number of visitors, then multiply by 100. A page with 50 enquiries from 2,000 visitors has a 2.5% conversion rate. Simple enough. The real complexity lies in knowing which conversions to measure and how to segment the data.
Conversions split into two types. Macro conversions are your primary goals: a completed sale, a booked consultation, or a submitted contact form. Micro conversions are the smaller steps that signal intent: a product page view, a pricing page visit, or a video play. Tracking micro conversions helps you identify where visitors drop off before reaching the macro goal.
Segmenting by channel, device, and page reveals where revenue leakage actually occurs. A site-wide average of 2% can mask a mobile rate of 0.8% and a desktop rate of 4.5%. Those are two entirely different problems requiring two entirely different fixes.
Pro Tip: Never optimise based on site-wide averages alone. Pull your conversion data by traffic source, device type, and individual landing page before drawing any conclusions.
The table below shows how benchmarks differ by sector in the UK:
| Sector | Typical conversion rate |
|---|---|
| UK e-commerce (average) | 1.51% |
| Professional services (paid search) | 3–6% |
| Tech and SaaS (demos and trials) | 2–5% |
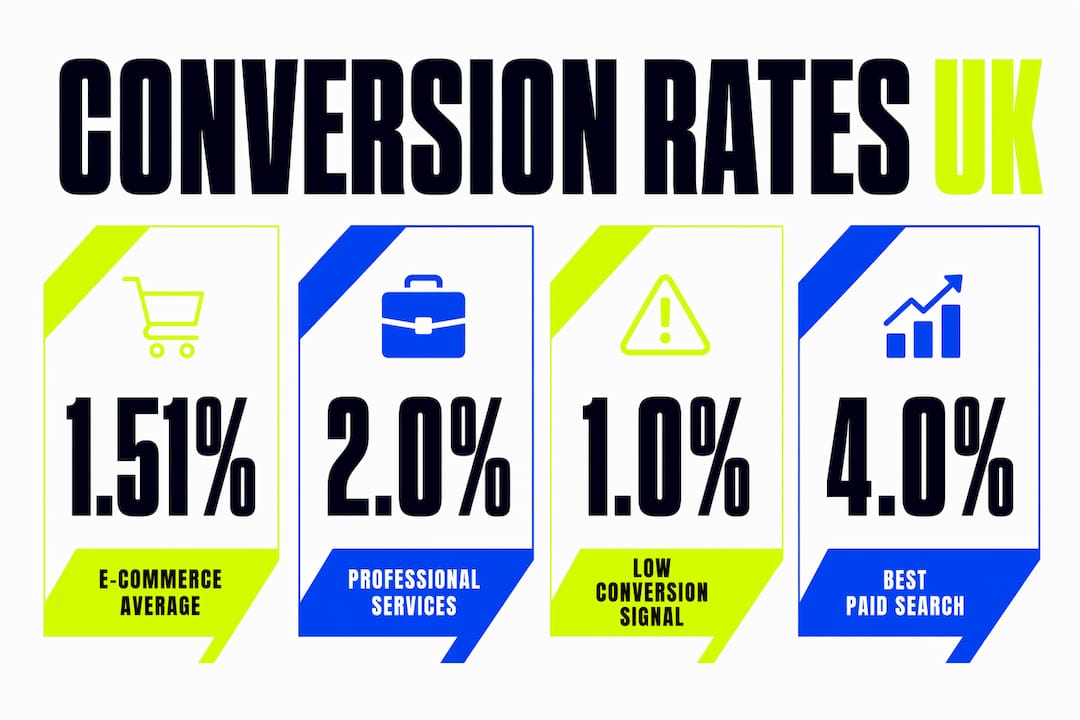
UK professional services benchmarks confirm that context matters enormously. Beating your own baseline is the goal, not chasing a generic industry figure.
What are the key techniques for effective conversion optimisation?
CRO works through a combination of quantitative data and qualitative insight. Neither alone is sufficient. Quantitative data tells you what is happening. Qualitative data tells you why.
The most widely used conversion optimisation techniques are:
- A/B testing — Show two versions of a page to different visitor segments and measure which performs better. Headline testing alone can drive uplift of between 27% and 104%. That range shows just how much copy quality affects results.
- Heatmaps and session recordings — Tools that visualise where visitors click, scroll, and abandon. They surface friction points that analytics data cannot show.
- Funnel analysis — Map every step from landing page to conversion. Identify the single step with the highest drop-off rate and fix that first.
- CTA optimisation — Changing button copy from a generic label like “Submit” to a specific phrase like “Get Your Free Quote” consistently lifts click-through rates.
- User feedback surveys — Exit-intent surveys and on-page polls capture objections you would never find in a spreadsheet.
Prioritise changes by two factors: the strength of the evidence supporting the change, and the estimated impact on your primary conversion goal. A change backed by heatmap data, session recordings, and user feedback carries far more weight than a hunch about button colour.
CRO is iterative by nature. Evidence-based CRO replaces subjective design opinions with statistical testing, and the results compound over time. One successful test informs the next hypothesis. That cycle is what separates businesses that grow consistently from those that plateau.

Pro Tip: Build a simple prioritisation matrix. Score each test idea on potential impact (1–5), confidence in the evidence (1–5), and ease of implementation (1–5). Run the highest-scoring tests first.
Which barriers reduce website conversion rates most?
Low conversion rates almost always trace back to structural problems, not cosmetic ones. Changing a button colour rarely moves the needle. Fixing a confusing value proposition often does.
The most common barriers are:
- Unclear value proposition — Visitors cannot tell within five seconds what you do, who you serve, or why they should choose you. A well-structured homepage layout resolves this faster than any design refresh.
- Weak or confusing CTAs — Multiple competing calls to action split attention. One primary CTA per page outperforms three competing ones every time.
- Lack of trust signals — No reviews, no accreditations, no client logos. UK buyers are cautious. Social proof is not optional.
- Slow page speed — Page load time directly affects conversions. Every additional second of load time reduces the probability that a visitor stays.
- Mobile experience gaps — Mobile accounts for around 83% of UK traffic, yet mobile conversion rates sit at roughly 2.5% compared to desktop rates of around 5%. That gap represents a significant volume of lost revenue.
Rates below 1% generally indicate homepage or CTA structural problems rather than traffic quality issues. If your rate sits there, start with your homepage headline and your primary CTA before touching anything else.
Pro Tip: Run a five-second test with someone unfamiliar with your business. Show them your homepage for five seconds, then ask: “What does this company do?” If they cannot answer clearly, your value proposition needs work.
| Barrier | Fix |
|---|---|
| Unclear value proposition | Rewrite headline to state who you help and how |
| Weak CTAs | Use one specific, benefit-led call to action per page |
| No trust signals | Add reviews, accreditations, and client logos above the fold |
| Slow load speed | Compress images, reduce scripts, use a content delivery network |
| Poor mobile experience | Audit and redesign mobile layouts separately from desktop |
How does conversion optimisation impact business growth and ROI?
CRO delivers revenue growth without increasing your traffic spend. Doubling your conversion rate from 1% to 2% doubles your revenue from the same number of visitors. No additional advertising budget required.
Compare that to paid search. Driving more traffic costs money on every click. Improving what happens after the click costs a fraction of that, and the gains are permanent. Data-driven CRO typically yields measurable uplift within 4–8 weeks. That is a faster return cycle than most SEO or brand campaigns.
The commercial case is clear:
- Higher conversion rates mean lower cost per acquisition across every channel.
- Improved funnel efficiency makes paid media budgets go further.
- Better user experience reduces bounce rates, which can improve organic search rankings over time.
- Systematic testing builds institutional knowledge about what your specific audience responds to.
Professional UK CRO retainers typically cost £1,500 to £6,000 per month, with audits ranging from £900 to £3,500. For most small and medium businesses, the right starting point is a focused audit and a website conversion checklist rather than a full retainer. Fix the obvious friction points first. The return on that initial investment is usually visible within two months.
Key takeaways
Conversion optimisation delivers the highest commercial return when it is evidence-based, segmented by device and channel, and applied iteratively rather than as a one-off redesign.
| Point | Details |
|---|---|
| Know your baseline | The UK e-commerce average is 1.51%; rates below 1% signal structural problems. |
| Segment your data | Break conversion rates down by device, channel, and page to find where visitors drop off. |
| Prioritise structural fixes | Unclear value propositions and weak CTAs cause more damage than minor design issues. |
| Test before you assume | A/B testing and heatmaps replace guesswork with evidence, driving reliable uplift. |
| CRO beats traffic spend | Improving conversion rates grows revenue without increasing advertising budgets. |
The CRO mistake I see UK businesses make repeatedly
Most businesses treat conversion optimisation as a one-time project. They commission a redesign, launch the new site, and expect the numbers to improve. When they do not, the instinct is to redesign again. That cycle is expensive and rarely productive.
The real problem is that redesigns are driven by opinion. Someone in the business dislikes the colour scheme, or a competitor has a new layout, and that becomes the brief. Evidence plays no part. The result is a site that looks different but converts at the same rate, because the structural barriers were never identified or addressed.
What actually works is disciplined, systematic testing. You form a hypothesis based on data. You test it against a control. You measure the result. You apply what you learn to the next hypothesis. That process is slower than a redesign, but it compounds. After six months of consistent testing, you have a site that reflects what your specific audience actually responds to, not what someone in a meeting thought looked good.
UK businesses also tend to underestimate the role of trust in conversion. British buyers are sceptical. They read reviews, check credentials, and look for signals that a business is legitimate before they act. A site that lacks social proof, clear contact details, and visible accreditations will convert poorly regardless of how well the CTA is written. Digital branding and trust signals are not decorative. They are functional conversion assets.
— Kukoo
How Kukoocreative helps businesses convert more visitors
Good conversion rates start with good design. A confusing layout, an inconsistent brand, or a slow-loading site will undermine even the best CRO strategy. At Kukoocreative, we have spent over a decade helping UK business owners build websites and brand identities that earn trust and drive enquiries.
Our web design process is built around your business goals, not just aesthetics. Every layout decision, every CTA placement, and every trust signal is considered with conversion in mind. If you want a website that works as hard as you do, take a look at our portfolio to see what we have delivered for businesses like yours. We would love to help you build something credible, clear, and genuinely effective.
FAQ
What is CRO in simple terms?
CRO stands for Conversion Rate Optimisation. It is the process of increasing the percentage of website visitors who take a specific action, such as making a purchase or submitting an enquiry.
What is a good conversion rate for a UK website?
The UK e-commerce average sits at 1.51% as of january 2026. Professional services businesses on paid search typically see 3–6%, while tech and SaaS companies average 2–5% for demos and trials.
How long does conversion optimisation take to show results?
Data-driven CRO typically delivers measurable uplift within 4–8 weeks. Changes based on evidence rather than opinion produce results significantly faster than opinion-led redesigns.
What are the most effective conversion optimisation techniques?
A/B testing, heatmap analysis, funnel analysis, CTA copy testing, and user feedback surveys are the most widely used and effective CRO techniques for UK businesses.
Why is my mobile conversion rate so much lower than desktop?
Mobile accounts for around 83% of UK web traffic, but mobile conversion rates average around 2.5% compared to roughly 5% on desktop. The gap is usually caused by poor mobile layouts, slow load times, and CTAs that are difficult to tap on smaller screens.