
TL;DR:
- Analyzing website data helps businesses make informed decisions by focusing on traffic, engagement, and conversion metrics. Setting up accurate tracking and filtering internal traffic ensures reliable insights that guide growth strategies. Focusing on outcome metrics and interpreting data structurally improves website performance and marketing results.
Website data analysis is the process of collecting, interpreting, and applying visitor behaviour and performance metrics to improve business results. For business owners and digital marketers, knowing how to analyse website data is the difference between guessing at improvements and making decisions grounded in evidence. This guide covers the metrics that matter, how to set up your analytics environment correctly, and a clear workflow for turning raw numbers into real improvements. You will also find common pitfalls to avoid and practical steps you can apply immediately.
What metrics should you prioritise when analysing website data?
The most important website metrics fall into three categories: traffic volume, engagement quality, and conversion performance. Each category tells a different part of the story, and reading them together gives you a complete picture.
Traffic volume metrics include users, sessions, and pageviews. Users counts unique individuals. Sessions counts visits, including repeat visits from the same person. Pageviews counts every page loaded. These numbers tell you how many people are arriving and how much of your site they are seeing.
Engagement quality metrics tell you what visitors do once they arrive. The most widely used engagement signal is bounce rate, but its meaning depends entirely on context. Benchmark bounce rates vary by page type: content and blog pages sit at 65–80%, B2B SaaS at a median of 65%, and e-commerce at 45–65%. A bounce rate above 70% on a conversion page signals an urgent problem. That same rate on a blog post is perfectly normal.
Modern analytics platforms have introduced a more reliable signal: the engaged session. An engaged session is defined as a visit lasting at least 10 seconds, viewing at least 2 pages, or completing a conversion event. This replaces the old bounce rate as the primary engagement measure. It rewards meaningful visits rather than penalising single-page reads that still deliver value.
| Metric | What it measures | Typical benchmark |
|---|---|---|
| Bounce rate (blog) | Single-page visits on content pages | 65–80% |
| Bounce rate (e-commerce) | Single-page visits on product pages | 45–65% |
| Engaged session rate | Quality visits meeting engagement criteria | Aim above 50% |
| Conversion rate | Visitors completing a target action | Varies by industry |
| Search visibility score | Share of Google impressions captured | Higher = stronger SEO |
Conversion metrics are the most direct link between your website and your business goals. Outcome-based metrics such as organic clicks, conversions by channel, and cost per acquisition give clearer insight into real marketing performance than raw traffic volumes alone. Track these alongside your website optimisation steps to connect data to decisions.
Pro Tip: Set up conversion events for every meaningful action on your site: form submissions, phone clicks, file downloads, and purchases. Without these, you are measuring activity rather than results.
How should you set up analytics for accurate data collection?
Accurate analysis starts with a clean data environment. Garbage in means garbage out, and most analytics setups have at least one contamination problem from the start.
The most overlooked issue is internal traffic. Unfiltered internal sessions from your office, remote team members, and agencies inflate engagement and conversion metrics, skewing your analysis. Exclude your own IP addresses and any agency IPs before you draw a single conclusion from your data.
Bot traffic is a related problem. Analytics platforms filter bots automatically for accurate user counts, but this filtering is not always complete. Review your traffic sources regularly and look for sessions with zero engagement that arrive in large, sudden spikes.
A reliable analytics setup requires these foundations:
- Filter internal IPs from all reports, including remote workers and third-party agencies
- Connect Google Search Console to your analytics platform for unified search and behaviour data
- Use Google Tag Manager to manage tracking codes without editing site code directly
- Define conversion events before you start collecting data, not after
- Audit your setup quarterly to catch broken tags, missing events, or new pages without tracking
Pro Tip: Test your conversion tracking in real time using the preview mode in Google Tag Manager. Fire each event manually and confirm it appears in your analytics platform before going live.
How do you interpret website data step by step?
Interpreting site performance data is a structured process, not a single glance at a dashboard. Follow these steps to move from raw numbers to decisions.

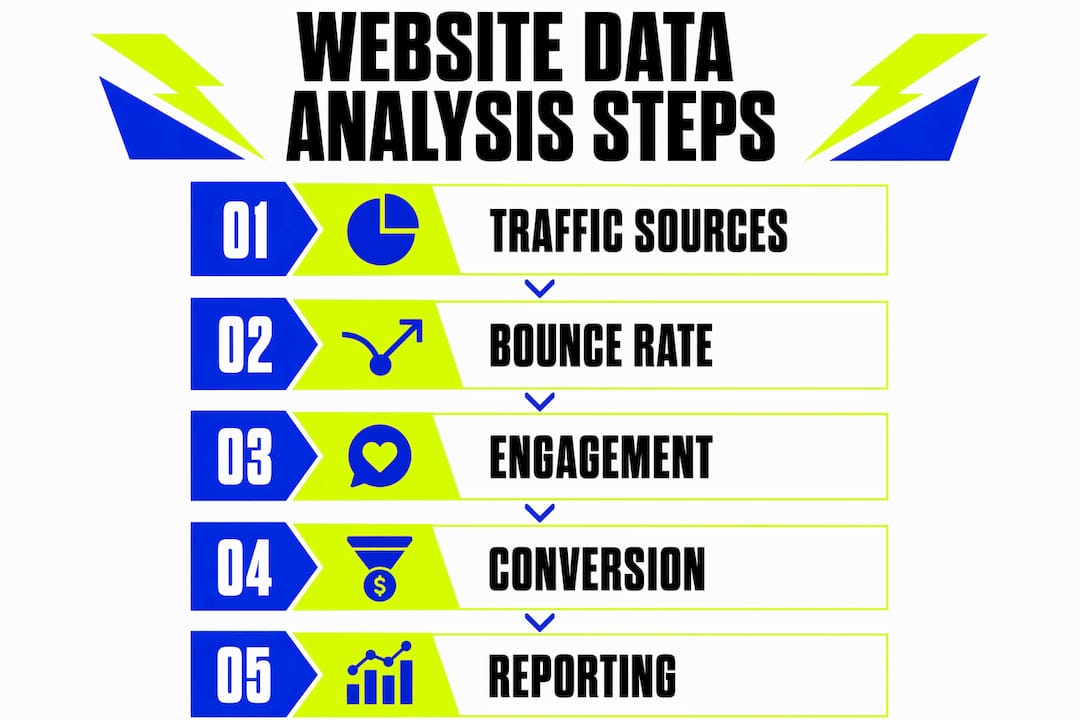
1. Start with traffic sources. Organic search, paid ads, direct, referral, and social each bring visitors with different intentions. A visitor from a branded search query is far more likely to convert than one from a broad informational keyword. Segment your data by channel before drawing any conclusions.
2. Apply page-level segmentation to bounce rates. Bounce rate’s interpretation depends on page intent. A high bounce on a blog post is expected. A high bounce on a pricing or checkout page requires immediate investigation. Never apply a single bounce rate threshold across your entire site.
3. Combine engagement rate with session behaviour. Look at engaged sessions alongside average session duration and pages per session. These three signals together reveal whether visitors are finding what they need or leaving frustrated. Use your website usability guide to cross-reference UX issues with data signals.
4. Assess your search visibility score. A search visibility score estimates the percentage of Google search impressions you capture for your target queries. A score of 12.4% means you appear in roughly 1 in 8 relevant searches. This gives you a far richer picture of SEO performance than raw impression counts from Search Console alone.
5. Review conversion paths. Identify which pages visitors pass through before converting. If a particular page consistently appears in successful paths, protect it. If a page consistently appears where visitors drop off, fix it.
6. Cross-reference quantitative data with qualitative signals. Heatmaps, session recordings, and on-site surveys reveal the “why” behind the numbers. A page with a high bounce rate and a heatmap showing visitors scrolling past a broken image tells you exactly what to fix.
| Analysis method | Best used for | Key signal to watch |
|---|---|---|
| Traffic source segmentation | Understanding visitor intent | Channel conversion rate |
| Page-level bounce analysis | Identifying problem pages | Bounce rate vs. page type |
| Engagement rate review | Measuring content quality | Engaged session percentage |
| Search visibility scoring | Assessing SEO reach | Visibility score trend |
| Conversion path analysis | Improving funnel performance | Drop-off page identification |
Pro Tip: Build a simple weekly report that tracks five metrics: sessions, engaged session rate, top traffic source, conversion rate, and search visibility score. Consistency over time reveals trends that single snapshots miss.
What are the most common mistakes in website data analysis?
The most damaging mistakes in website data analysis are not technical errors. They are interpretation errors, and they lead to confident decisions built on false premises.
- Panicking over a high bounce rate without context. A 75% bounce rate on a blog post is healthy. The same rate on a landing page is a serious problem. Always filter by page type before reacting.
- Ignoring internal traffic contamination. Your own team visiting your site daily can double your session count on a small business website. Exclude internal IPs before any analysis.
- Trusting session duration as a standalone metric. Session duration alone can be misleading. A visitor who is lost and a visitor who is deeply engaged may spend the same amount of time on a page. Combine duration with pageviews and conversion events for context.
- Relying on raw pageviews as a success measure. High pageviews with low conversions and low engagement signal a traffic quality problem, not a success.
- Skipping qualitative validation. Numbers tell you what is happening. User feedback and session recordings tell you why. Use both together.
Pro Tip: Schedule a monthly data hygiene check. Confirm your conversion events are firing, your IP filters are current, and your goals still reflect your actual business objectives. Analytics setups drift over time.
Key takeaways
Effective website data analysis requires clean data, the right metrics, and a structured interpretation process applied consistently over time.
| Point | Details |
|---|---|
| Prioritise engagement over volume | Engaged sessions and conversion rates reveal more than raw pageviews or session counts. |
| Context determines bounce rate meaning | A bounce rate above 70% is only a problem on conversion-focused pages, not blog content. |
| Clean data before you analyse | Filter internal IPs and bot traffic before drawing any conclusions from your analytics. |
| Use search visibility for SEO insight | A visibility score shows your true share of relevant Google searches, not just raw impressions. |
| Combine quantitative and qualitative data | Pair analytics data with heatmaps or user feedback to understand the reasons behind the numbers. |
What I have learned from years of watching businesses misread their data
Most business owners I speak with check their analytics once a month, look at total sessions, and feel either relieved or worried based on whether the number went up or down. That single habit is the root cause of most poor website decisions I see.
The businesses that grow consistently are the ones that ask a different question. Not “did traffic go up?” but “did the right people arrive, engage, and take action?” Those are three separate questions, and each one requires a different metric to answer.
I have seen companies pour money into paid traffic because their session count looked healthy, only to discover their engaged session rate was below 30%. The traffic was real. The interest was not. Switching focus to engagement quality and conversion path analysis changed their results within weeks, without spending an extra penny on ads.
The shift I encourage every business owner to make is from vanity metrics to outcome metrics. Outcome-based metrics like organic clicks, conversions by channel, and cost per acquisition connect your website directly to revenue. Everything else is context.
My honest advice: pick five metrics, track them weekly, and act on what you find. Consistency beats sophistication every time.
— Kukoo
How Kukoocreative helps you build a website worth analysing
Your analytics are only as good as the website behind them. A site with unclear navigation, weak visual hierarchy, or a confusing layout will produce poor engagement data no matter how well your tracking is configured.

At Kukoocreative, we have spent over a decade helping business owners build websites and brand identities that connect with the right people. We understand how professional web design affects user behaviour, and we build with engagement and conversion in mind from the start. If your data is telling you that visitors are leaving too quickly or not converting, the answer is often a structural or visual design issue. Our portfolio shows what a well-built site looks like in practice. When your website is designed to perform, your data becomes a genuine growth tool rather than a source of confusion.
FAQ
What is website data analysis?
Website data analysis is the collection and interpretation of visitor behaviour and performance metrics to improve site results. It covers traffic sources, engagement signals, and conversion tracking.
What is a good bounce rate for a website?
Bounce rate benchmarks vary by page type. Blog pages sit at 65–80%, e-commerce at 45–65%, and anything above 70% on a conversion page requires urgent review.
What is an engaged session in analytics?
An engaged session is a visit lasting at least 10 seconds, viewing 2 or more pages, or completing a conversion event. It is the modern replacement for bounce rate as the primary engagement measure.
Why should I filter internal traffic from my analytics?
Internal traffic from your team inflates session counts and distorts engagement metrics. Excluding internal IPs gives you an accurate view of real visitor behaviour.
What is a search visibility score?
A search visibility score estimates the percentage of relevant Google search impressions your site captures. A score of 12.4% means your site appears in roughly 1 in 8 relevant searches, giving deeper SEO insight than raw impression data alone.